Elections & Stock Market !!!
Stock market
For the past one year, I have heard many being worried about 2019 general elections – sceptical to invest in the stock market and scared about how the results of Lok Sabha election shall affect their portfolios. Amidst a lot of noise of confusion, at Panomac, we have tried to gauge the impact of elections on stock markets.
Let’s see the impact of last three general elections on the stock markets.
2004 Elections:
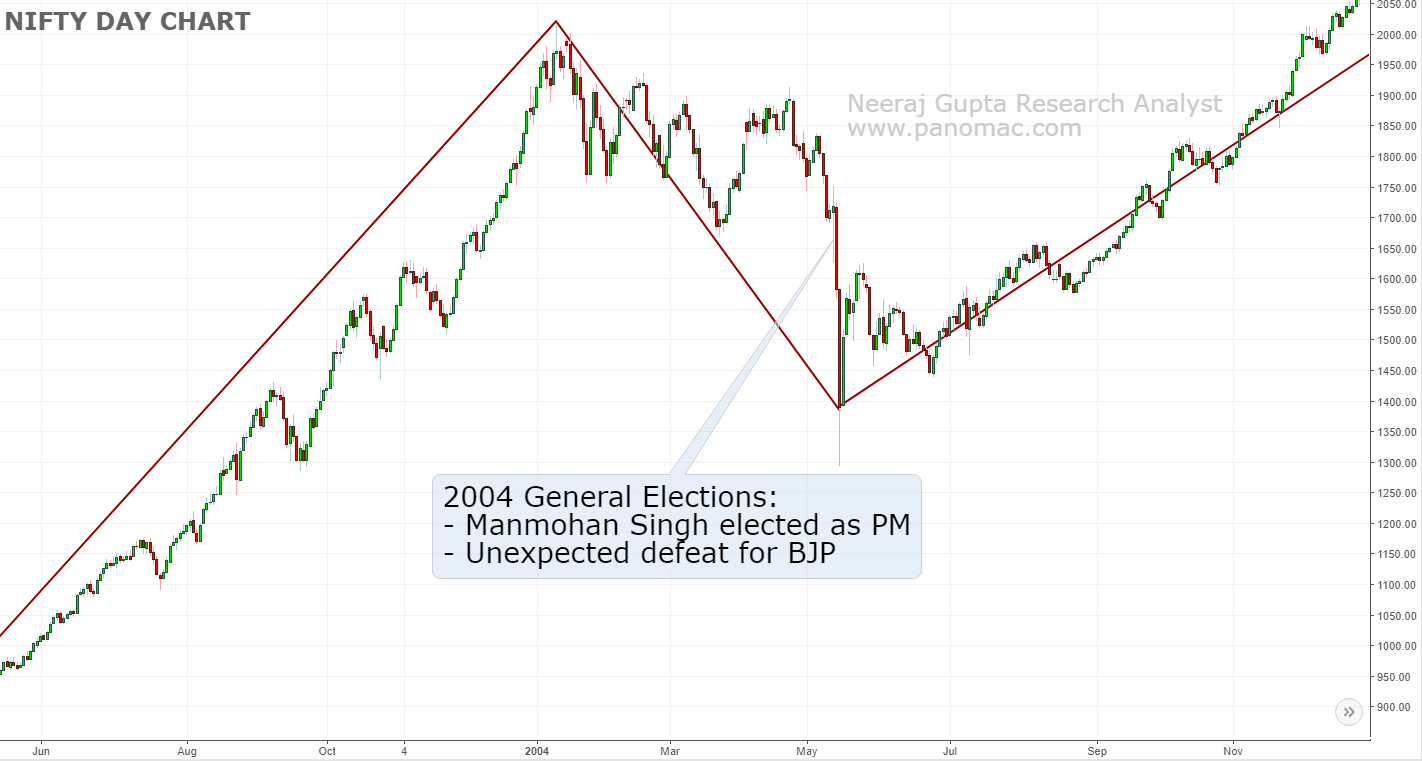
Outcome: Neutral to negative. It was expected that BJP (NDA) will form the government again, but the result was different - Manmohan Singh was elected as the Prime Minister with coalition government. For the markets, downtrend was expected to continue, with little or no recovery in the short-to-medium term.
Actual market movement: Until 2004, markets were in an uptrend, post which the downtrend (correction phase) started, 4-5 months prior election results. Election results were declared on May 13th, post which there was huge volatility with strong down movements. However, the market resumed its uptrend from mid-May, even post the unexpected election outcome taking investors with a surprise.
As per Panomac, correction period from Mar'04 onwards could have been used to gradually accumulate stocks. With proper cash management, 30-35% cash should have been used to buy during the volatility period around (and post) elections.
2009 Elections:
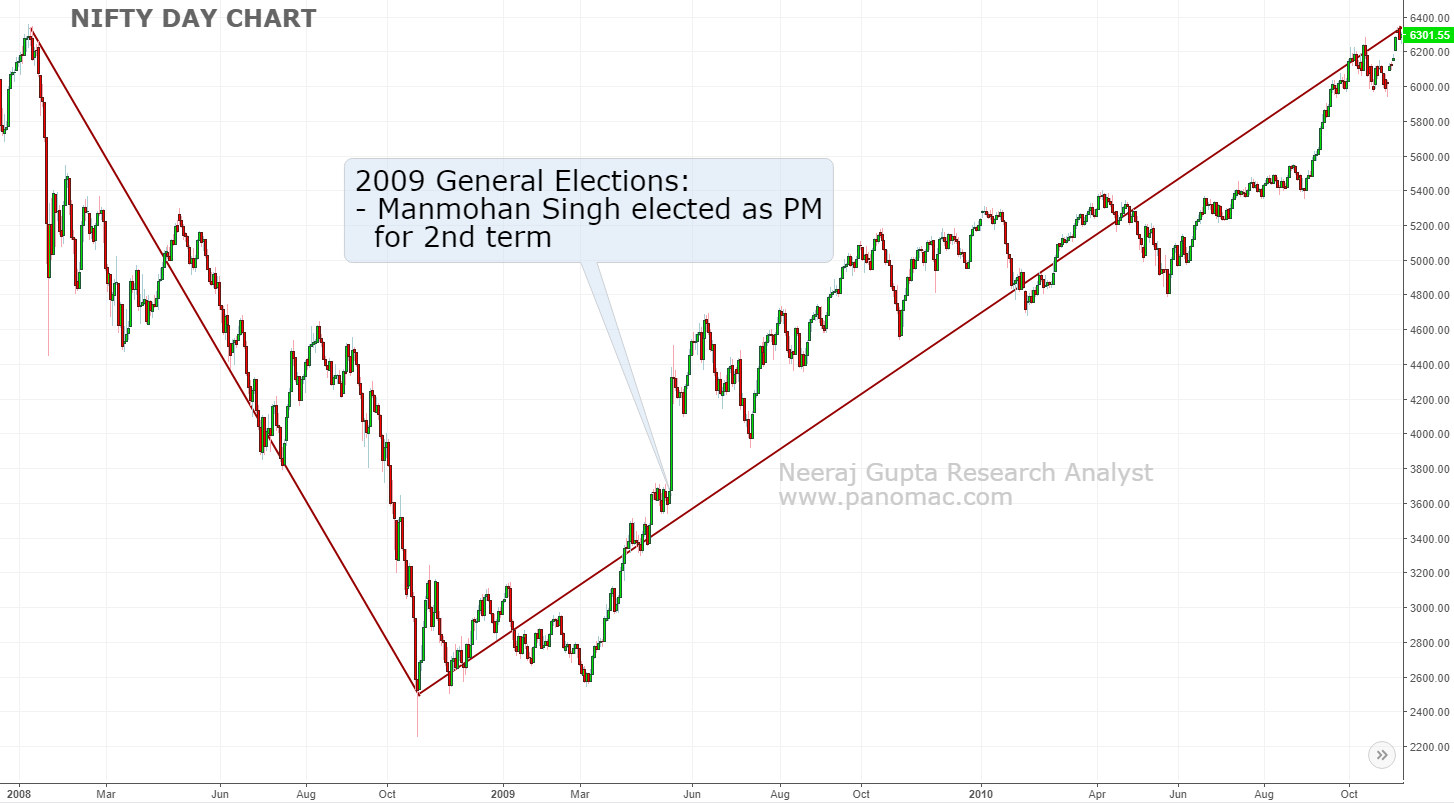
Outcome: Neutral to positive. Manmohan Singh came back to power with coalition government, and was seen as a sign of stability. For the markets, slightly bullish movement was expected.
Actual market movement: Post the huge downtrend in 2008, markets were trying to reverse since end of 2008. Post election results, with huge volatility, good bullish movement was seen for a couple of weeks, followed up by a correction bringing the market to nearly the same levels as during results. Post that, the market continued the uptrend.
As per Panomac, post 2008 huge downtrend, stocks were available at huge discounts. Time was to accumulate stocks since Sept-Oct'07. Little or no cash management was required for elections, as the stocks were bought at very attractive levels. Still, conservatively, a little profit booking could have been done to have kept 20-25% cash.
2014 Elections:
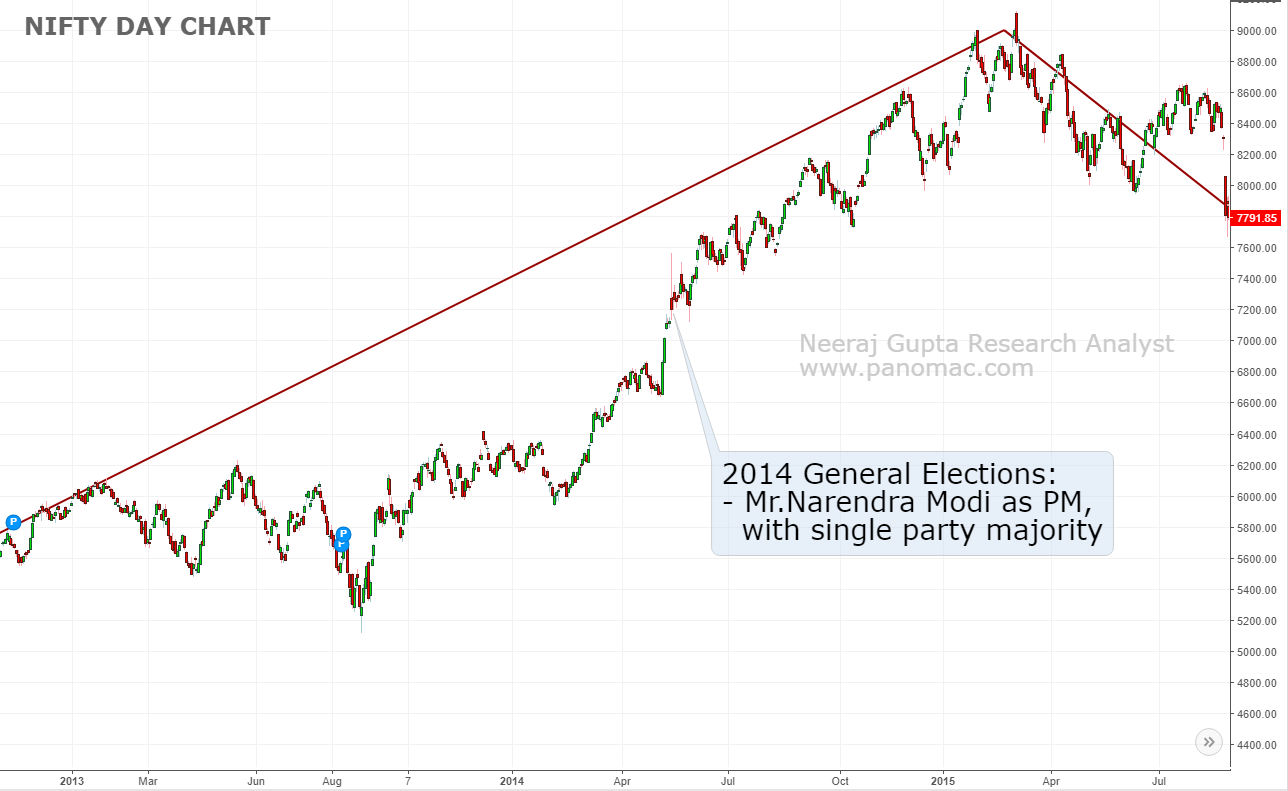
Outcome: Highly positive. BJP came in power with a single party majority. Modi wave, that started before elections, did continue, and there was huge euphoria in the markets. Huge upward movements were expected.
Actual market movement: Markets were already in an uptrend since early 2012. Huge volatility was witnessed during elections, post which the market continued its uptrend.
As per Panomac, stocks could have been accumulated during mid-2013 and end of 2013 (correction phase). Prior to elections, little profit booking with proper cash management could have been done, to reserve 30-35% cash levels for election time volatility.
Conclusion:
Looking at the last three election events, the following theme is witnessed:
- Markets have provided good opportunity to accumulate stocks prior to elections, during the correction phase
- There is huge volatility seen during election results timeframe: Cash management (to the extent of 20-35%) could be used to leverage volatility near elections
- Post elections, markets have not necessarily behaved as expected on basis of election results
What's happening now, and what's in it for me?
Correction in the markets started from 2018 and are already in place. This correction should be used for buying stocks. From elections point of view, there could be three outcomes:
- BJP coming-in again as a single majority party: Highly positive for the market and one should be fully invested, alike 2014. Prior to elections, now when the market has given good upmove, a little cash management could be done - ideal would be 20-25%.
- Congress coming-in as a single majority party: May be, negative for the market. But will it really impact stock markets much. Alike 2004, the correction phase in 2018-19 could be used to accumulate stocks, and 30-35% cash could be reserved for volatility post elections.
- Coalition goverment: May be, negative for the market. Alike 2009, we have had a decent correction and 30-35% cash levels can be maintained.
What is needed for a good investment is accumulation of good stocks during correction phase, and proper cash management to leverage volatility periods during election. Irrespective of elections, if stocks are available at attractive levels, one should buy.
But still, something holds us back. What is it - introspect and act. We shall be glad to help, do reach out or drop your mobile number below.
Not yet satisfied because "this time it's different". Are elections still haunting your investments?
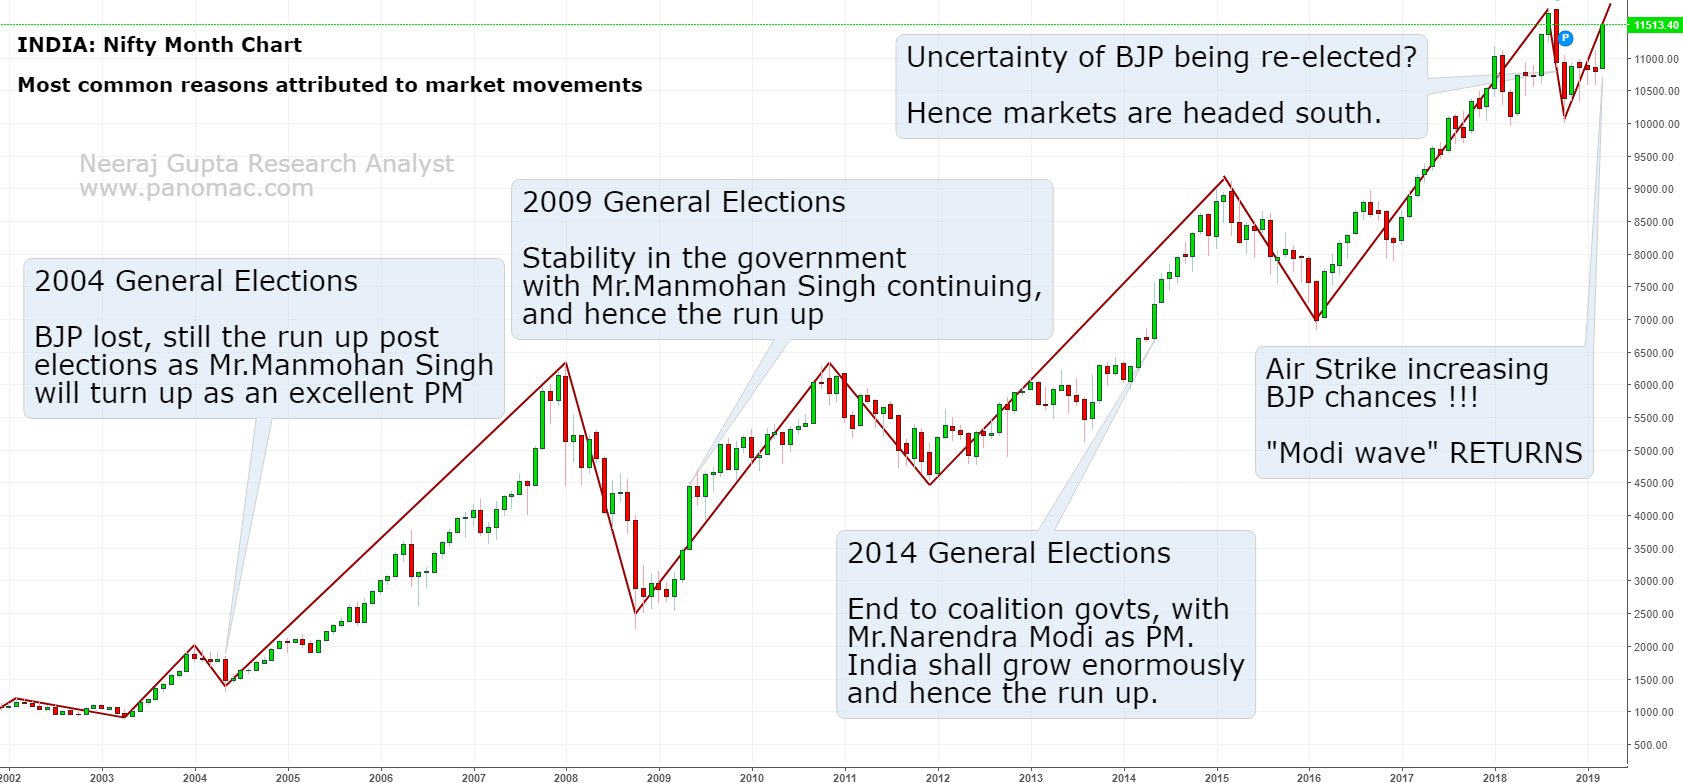
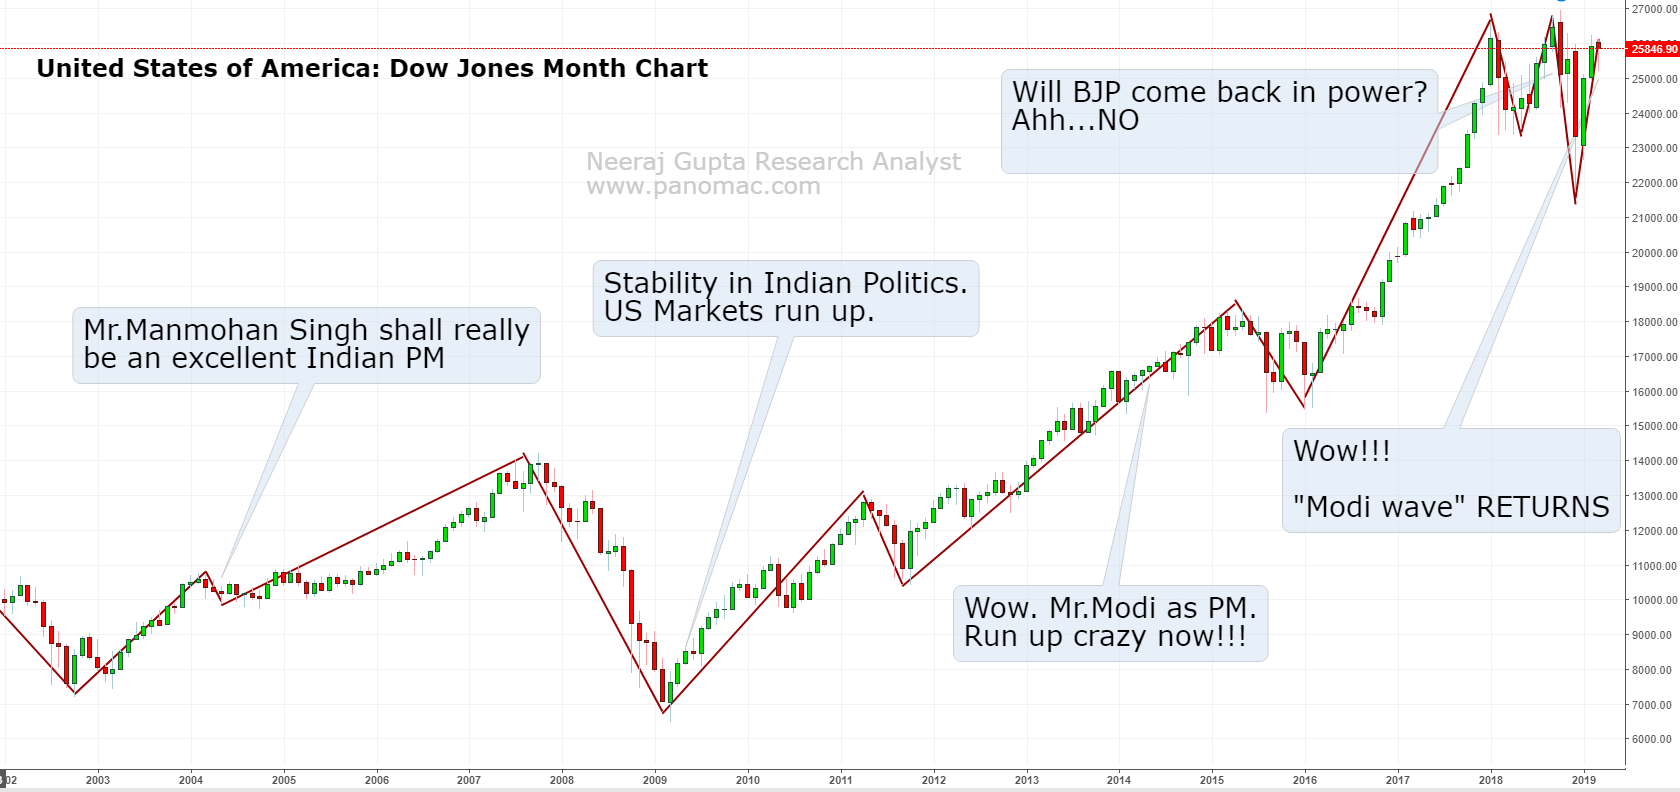
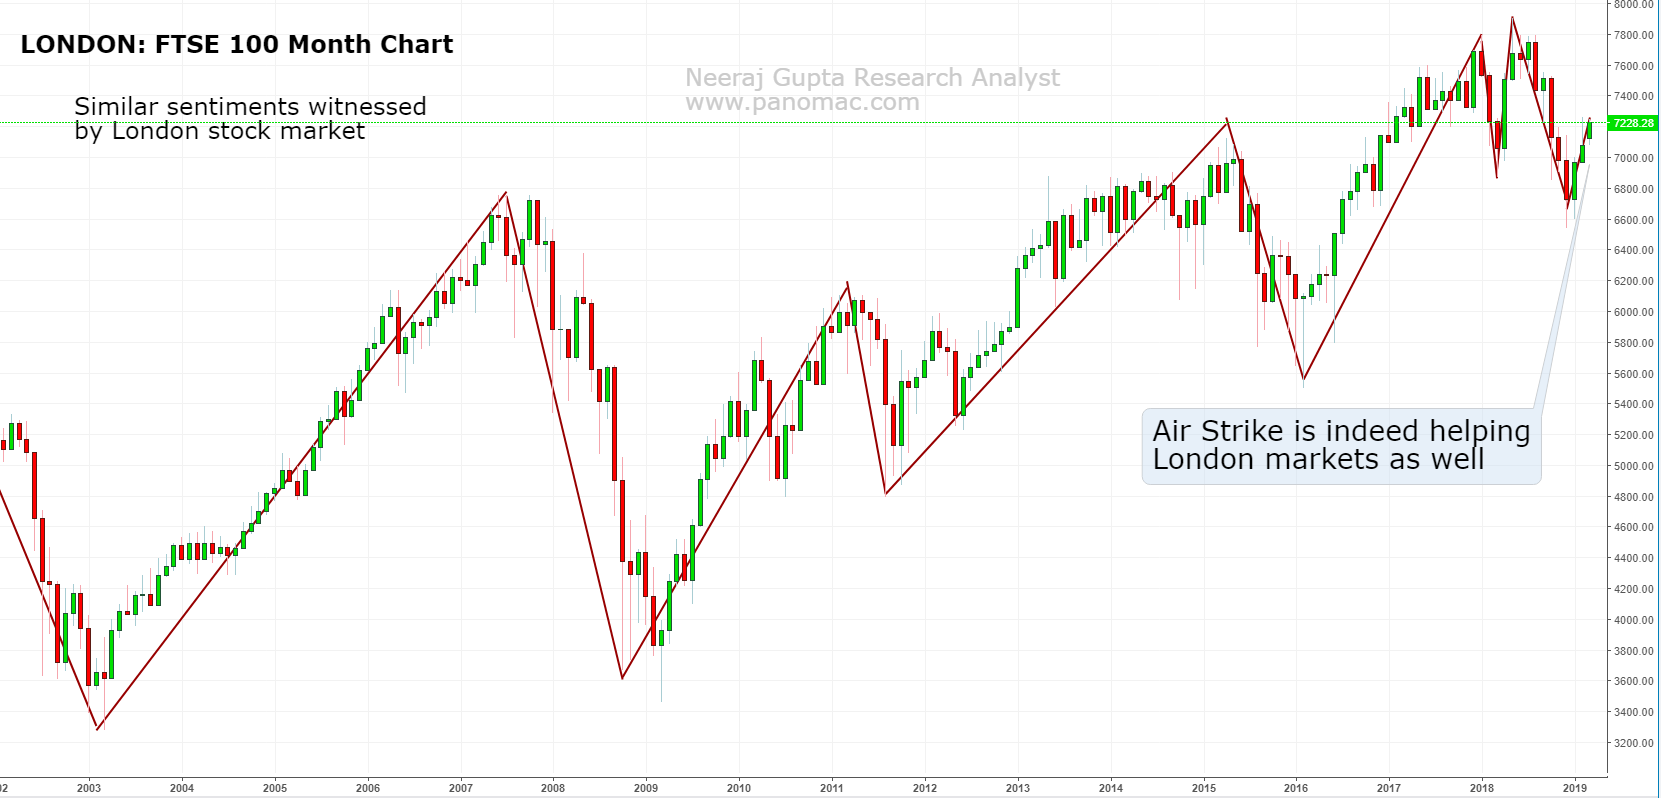
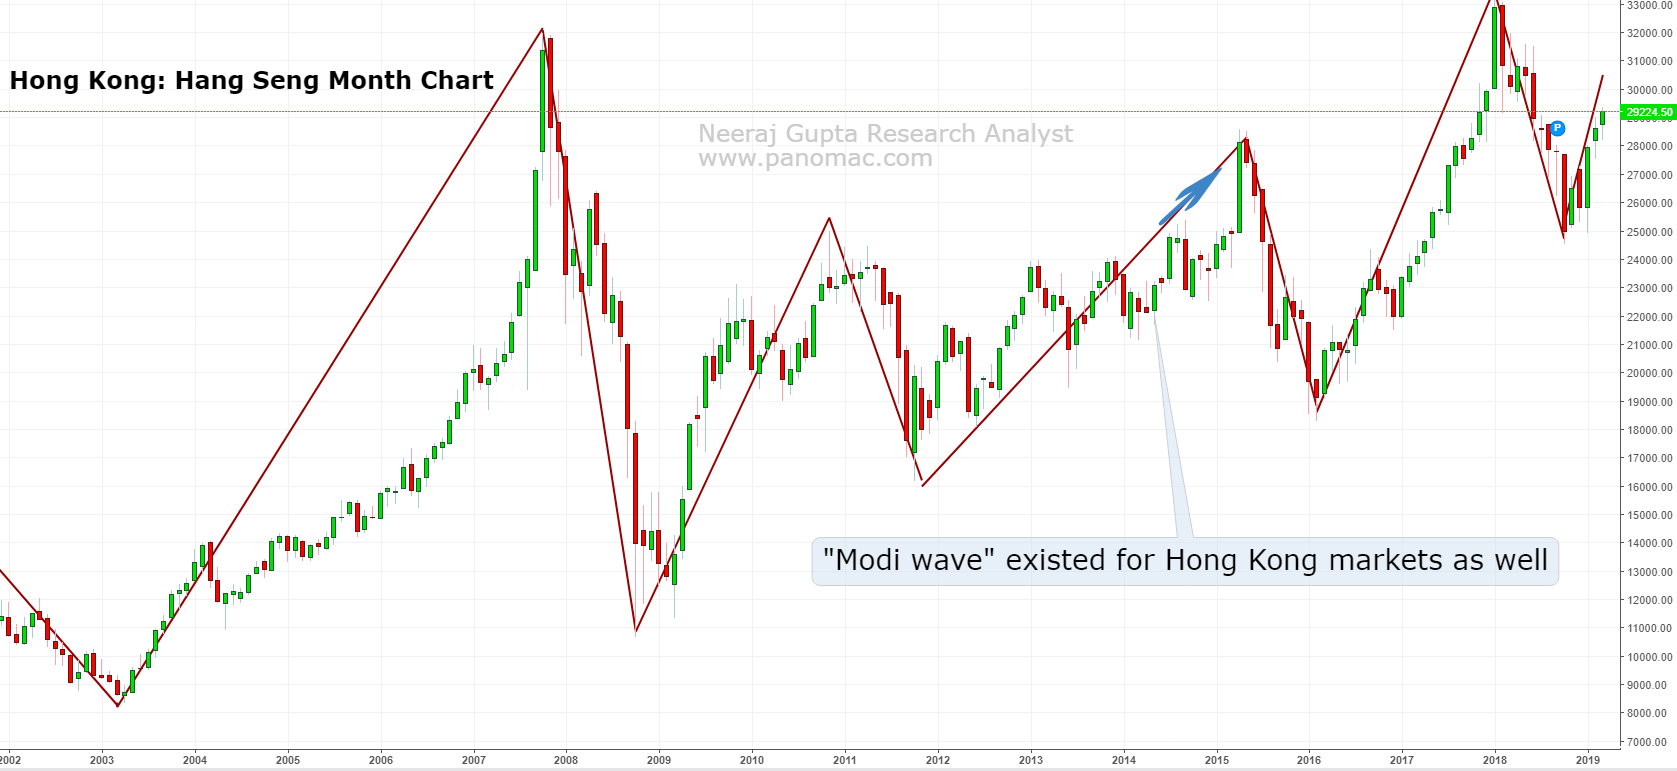
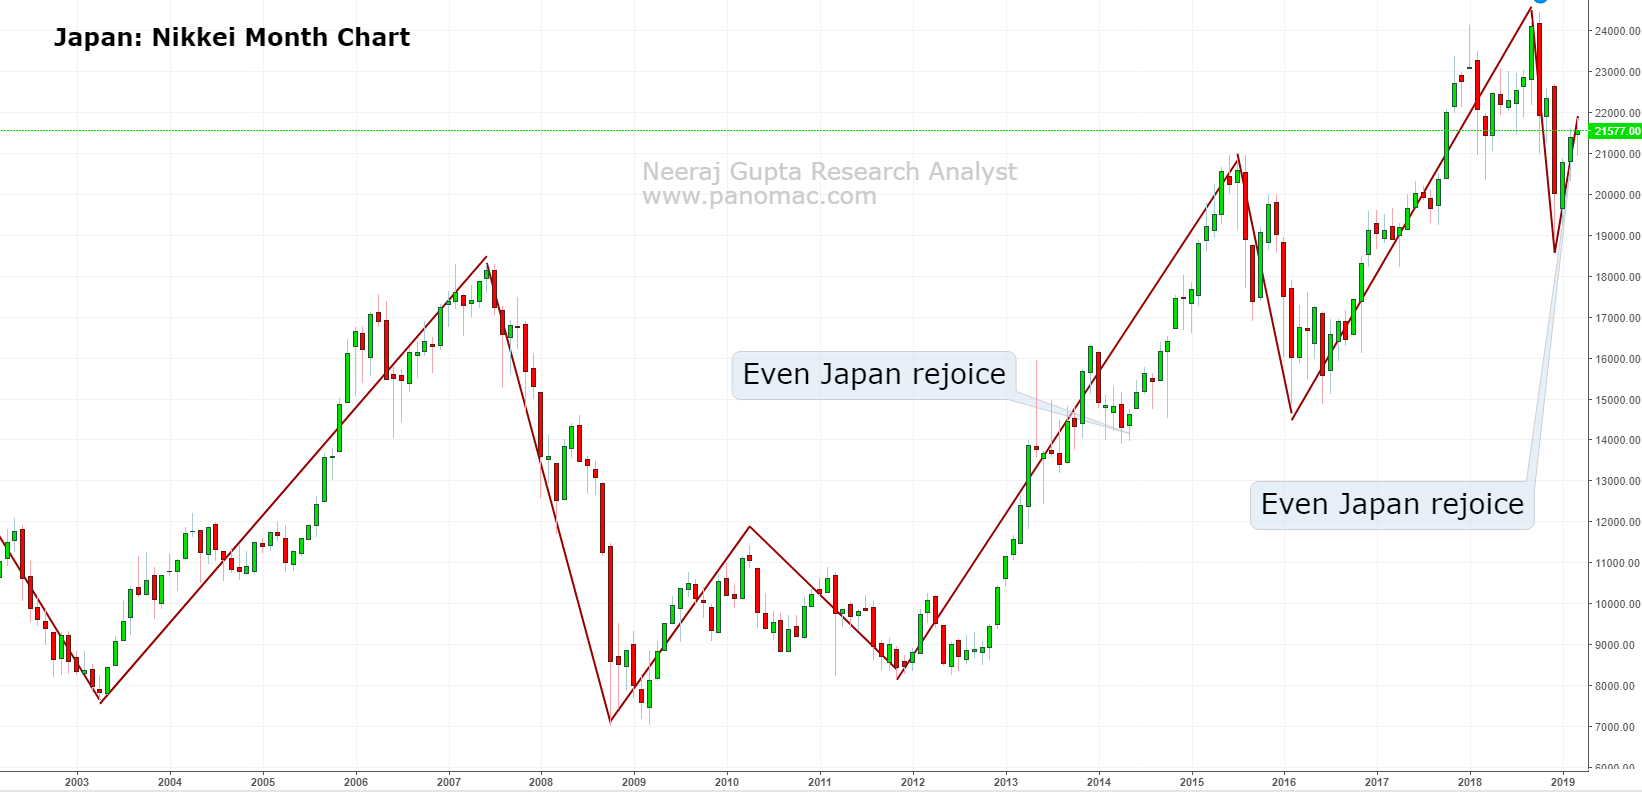
We always try to fit in a reason for market movement. Like the last downtrend was attributed to political uncertainty for 2019 elections, and then the latest uptrend is being attributed to "Modi wave" RETURNS post Air Strike. Do these reasons really justify the moves in the market? I dont think so.
As Warren Buffet has said - do not mix politics and investments. We would recommend that you leverage the correction phases and volatility periods to build a strong portfolio, if you believe that India still have a lot of scope for growth. Charts below shall explain more, why elections are not that important for stock markets.
Does it makes sense? Direction of markets are not defined by politics.
Shall really appreciate your comments and discussions below.
Source of charts: investing.com
Hi Rajeev, Thanks for your comment. Although the discussion is not related to the article, as the article talks about low dependence of elections on long term trends in the market, but I will answer your question - "if the market still has more steam to go up". Lets assume, Nifty do not move higher, but as there is a huge deviation in the performance of the stocks (mid-caps, small-caps, and even large caps) compared to Nifty performance. Nifty is at high PE due to a handful of stocks, while there lies investment opportunity in other stocks. So even if Nifty remain sideways, stocks might rise. So its going to stock specific investment theme in the near future. Also, PE is now an overrated indicator and can't be used in isolation. What worked in the past and is now known to all, might not work now. Just look at PE charts of US markets, they used to be in a range (just like NIFTY PE 13-28 range), and then suddenly they spiked to 41 as well. So, what leads to this spike ? Its the higher demand or liquidity in stock markets (cash available for investments). Drawing parallels with the concept of inflation, things become dearer and expensive, due to higher purchasing power, likewise, stock markets will become dearer and expensive due to increased participation. So is the participation increasing in Indian Stock Market. I think, the answer is yes. As a country, we are changing - we are investing more than savings in FD, or in the form of black money. Money is coming to the market, and that will automatically increase the PE range - who knows that 20 years down the line, people would buy and consider stock markets cheap at PE of 20, and expensive at PE of 40. As I said above, don't use PE as an indicator for your investments - couple it with other studies. No doubt, we are at high valuations, and need to be cautious. But you don't know till when we will remain at these high valuations...may be for the next 3 to 5 years. On your note on Automobile sector estimates, the industry is transforming in two sense: 1. Move to Electrical Vehicles. 2. Car Pooling / Better state run infra - metro / Cab services Uncertainty in the sector, and demand dries up when transformation happens. People preferring to be car less, and choose cab services, or awaiting EV before they replace their old car. I am not 100% sure on this, but commercial sector estimates are better. es to EV.
Really nice. What i understood, we are in global equities bulls run phase. Do you thing that market still has more steam to go up, at a time when we are trading at historically high Nifty 50 valuations (P/E 29.12, P/B 3.72, Div yield 1.13). US valuations are expensive too. Japan 253% Debt to GDP. Automobile manufacturer cutting growth estimates. Don't tell me that will get 25% earning growth this year.. Some other point please.
Very informative article...Thanks for sharing!
Nice read. Shall start accumulating now.
This is a very insightful article. Thanks for sharing
