NIFTY Oct Month Analysis
Stock market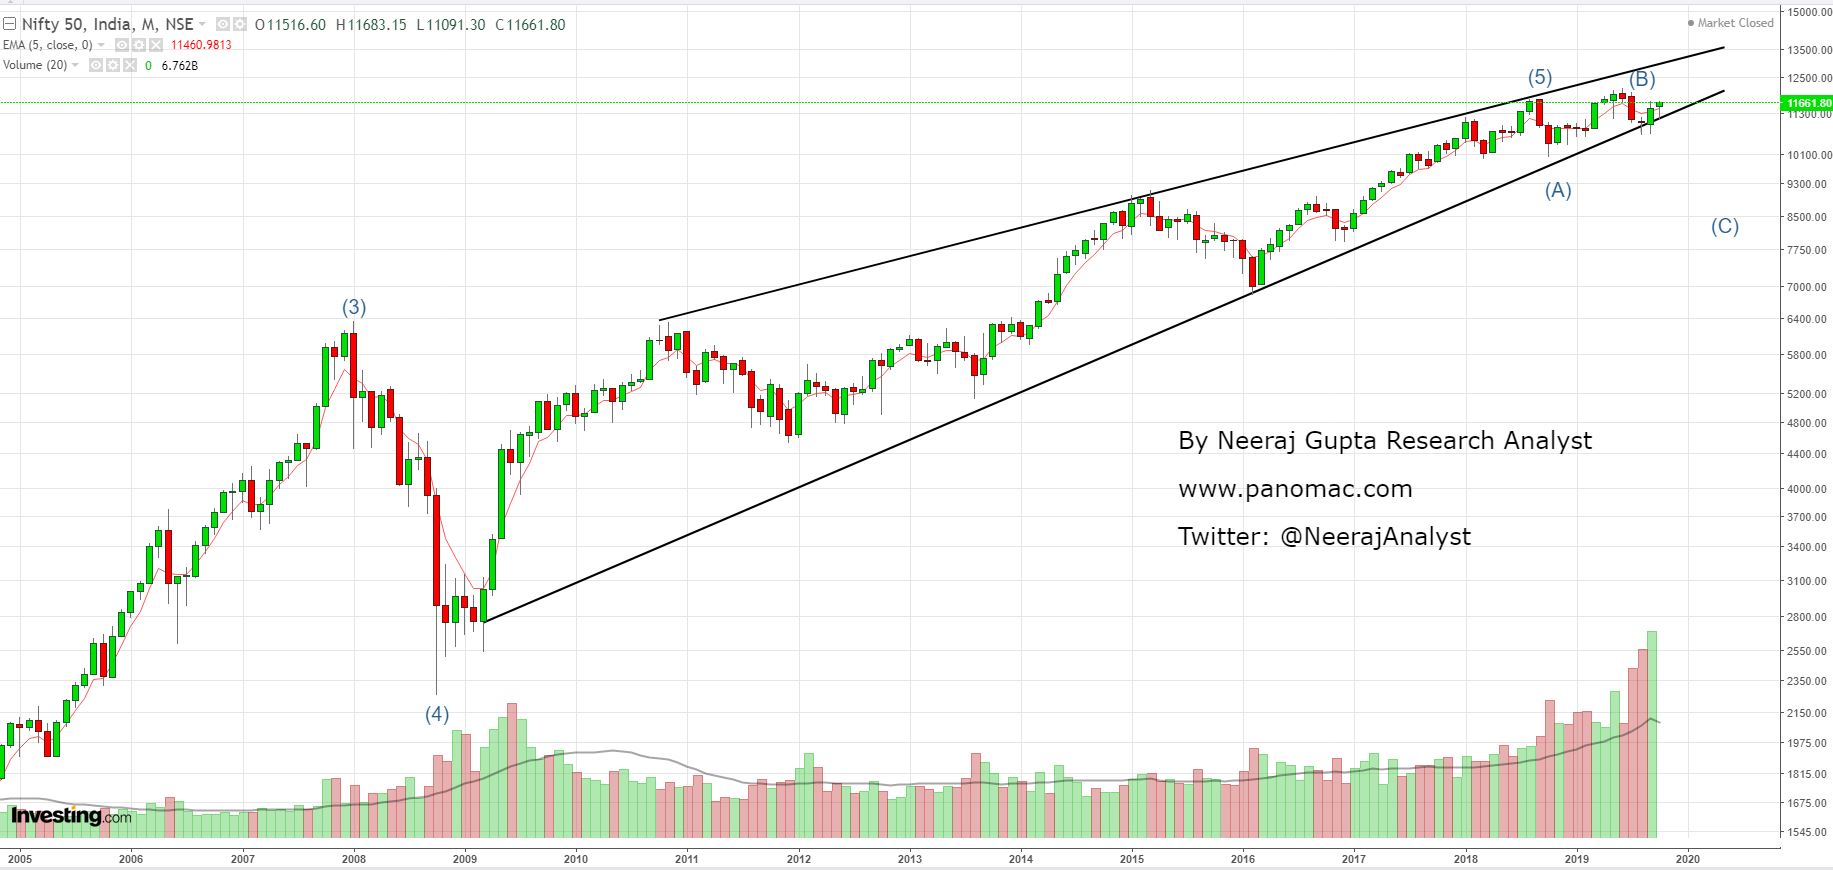
NIFTY TECHNICAL ANALYSIS: MONTHLY CHARTS
Nifty seems to have completed 5 up-moves on the long-term charts that started from 1998-1999. The 5th wave started from 2008-09, and has been taking a rising wedge shape (indicated by two black lines). Whether this complete up-move shall end here (in 5 waves) or continue in the form of extended waves (9/13 waves) will be a speculation, but what is more important is to analyse the current correction in place, that started from early 2018 (indicated by 5 on the charts).
The last major correction (4th wave) was a steep price correction in 2008, and hence, higher probability is that the current correction might be more of a time correction, with prices oscillating in a closed range. Post hitting the lower line of rising wedge (black line), and stamping a hammer pattern (after point B on chart), the prices are moving higher, as expected. I expect the correction is already over (with 18 months of sideways to slightly downward movement).
Another important point here is the huge rise in volumes, which could be an accumulation or distribution.
There are the following three probable scenarios:
- Correction already done (marked by A). Post that we have started a fresh up-move (7th wave) from ~10000 levels from Oct’18. More weightage gets added to this scenario, if the lower end of the wedge is not broken (~11050 levels) on a monthly closing basis, and the current up-move momentum continues from here. Invalidation point: A weekly close below 10640 levels.
- Correction takes the form of A-B-C waves, with C ending somewhere near 9600-9800 levels.
- Correction takes the form of A-B-C or A-B-C-D-E, with correction ending near 7800-8000 levels.
Looking at the volumes, I am more biased for scenario 1, and then for scenario 3. If it’s an accumulation, it will be scenario 1; and if it’s a distribution, it will be scenario 3.
On Monthly levels, strong support exists at 10000-10750 levels, and then 7800-8200 levels.
These scenarios and price ranges can be further narrowed down by weekly and day level analysis. Refer to the detailed research reports (on subscription basis), with more specific details on price levels. Feel free to contact, preferably via whatsapp @739 789 9111. Follow on twitter - @NeerajAnalyst
Let us briefly review Scenario 1 at weekly level:
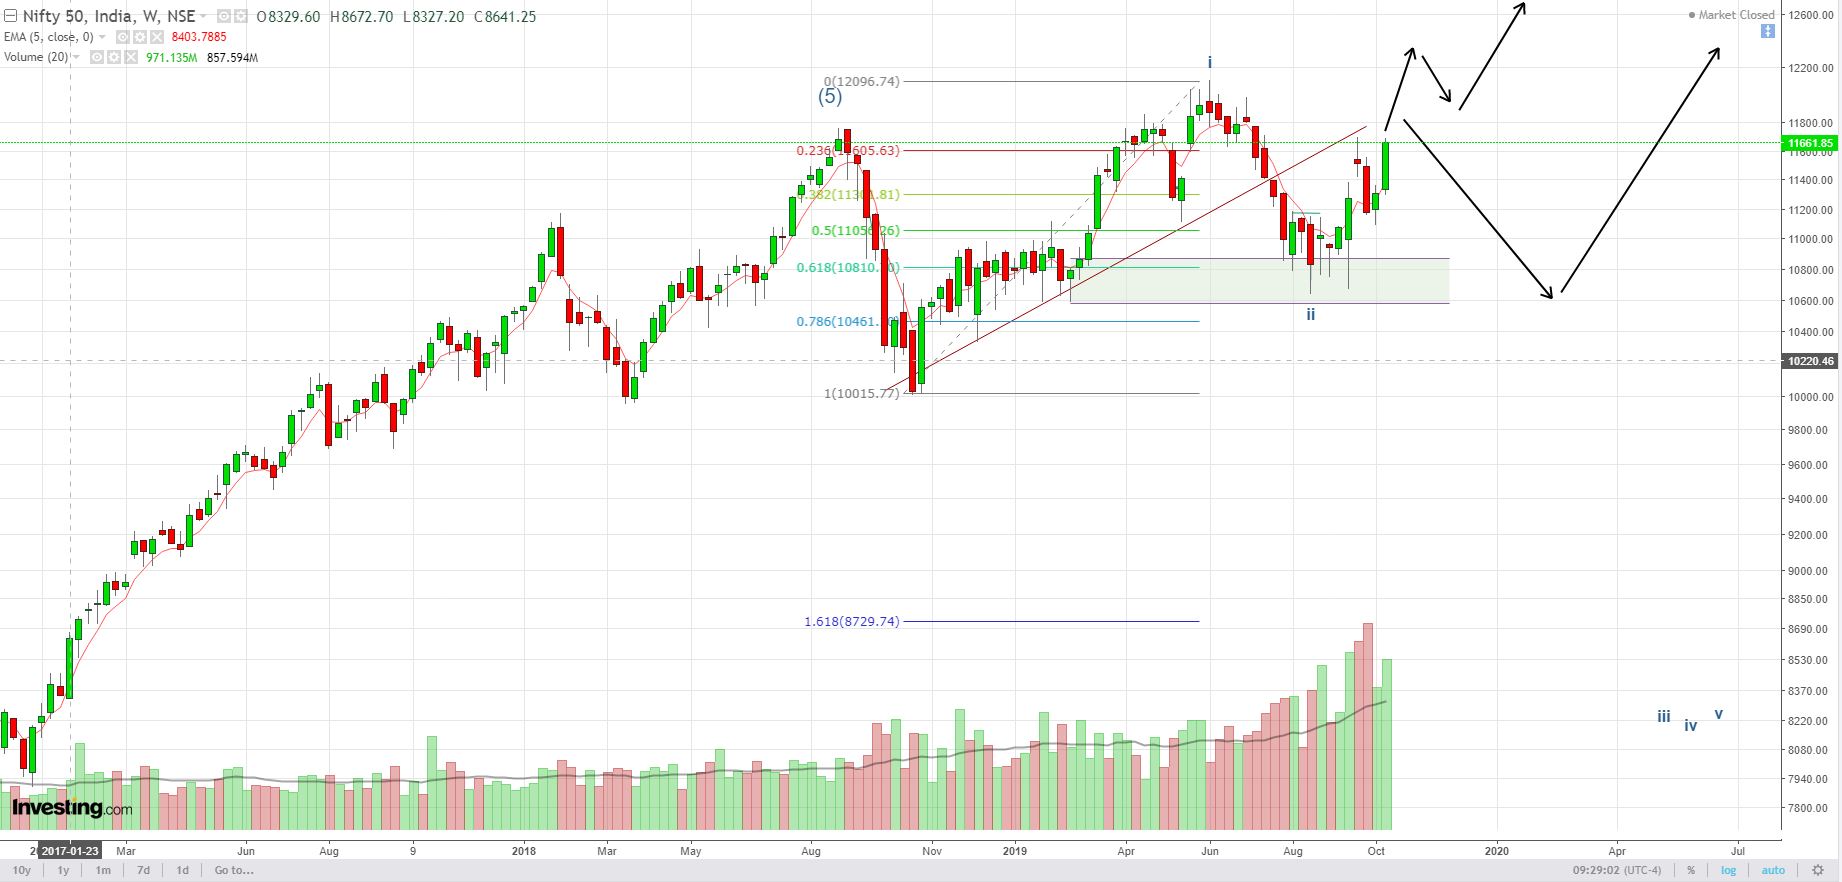
Scenario 1: We have started a fresh up-move (7th wave) from ~10000 levels from Oct’18. Post that, we have completed the first up-move to 12100 levels, and then retraced 61.8% at 10800 levels (in 5 clean waves down pattern). Post that, we have started an up-move from 10640 (19th Aug 2019), which would be the third trending wave and the most aggressive one. If this is indeed the third trending wave, then the first target would be 14k by as early as Apr 2020 (invalidation – day close below 11400).
We are currently at day level resistance zone of 10650-10725 levels, post which another resistance zone would be 11900-12100 levels. As indicated in my last update (2nd Sep), 11600 levels would be critical to watch for, and we will have to closely review further price action and catch the trend. Short term updates to posted on twitter (@NeerajAnalyst).
If NIFTY loses the momentum from here, then we might continue with the short term correction till 11050-11200 range.
PROBABLE USE OF ANALYSIS: Can be used by investors to align their decisions accordingly, into Stocks, Mutual Funds, ULIPs, and so on. However, please also refer to stock specific analysis, and other indices & sectoral analysis for any investment decisions, and consult a financial advisor.
Traders should further refer to lower timeframe (day/hour) level analysis, for taking trading decisions.
Refer to the detailed research reports (on subscription basis), with more specific details on price levels. Feel free to contact, preferably via whatsapp @739 789 9111. Follow on twitter - @NeerajAnalyst
Please post your comments below.
Disclaimer:
Neeraj Gupta Research Analyst has taken due care and caution in compilation of data for this report. However, Neeraj Gupta Research Analyst do not guarantee the accuracy, adequacy or completeness of any information on the report, nor do we assume any liability for any loss that may result from reliance upon any such information or recommendations.
Investment in the securities involves risks. The user of this report is required to undergo risk profiling before investing. No content should be construed to be an investment advice. You should consult a qualified financial advisor prior to making any actual investment or trading decisions. All information on this report is a point of view, and is for educational and informational use only. The author, Neeraj Gupta Research accepts no liability for any interpretation of articles or comments on this report being used for actual investments. Each user of this information should make such investigation as it deems necessary to arrive at an independent evaluation of an investment in the securities of companies referred here (including the merits and risks involved), and should consult his own advisors to determine the merits and risks of such investment. Past performance is not necessarily a guide to future performance.
While we may talk about strategies or positions in the market, our intent is solely to showcase effective risk-management in dealing with financial instruments. This is purely an information service and any trading done on the basis of this information is at your own, sole risk. Information and recommendations on the report are for general information only. Nothing contained herein is an offer to sell nor solicitation to buy any securities.
Disclosures:
I & my clients might hold positions in NIFTY via futures and options, traded on NSE. I & my relatives have no financial interest in the working of the companies construing NIFTY.
No Comments